Real-time dashboards
Occupancy, revenue and move-in trends update live across every site. The KPIs you check daily sit on one screen, with no exports required.
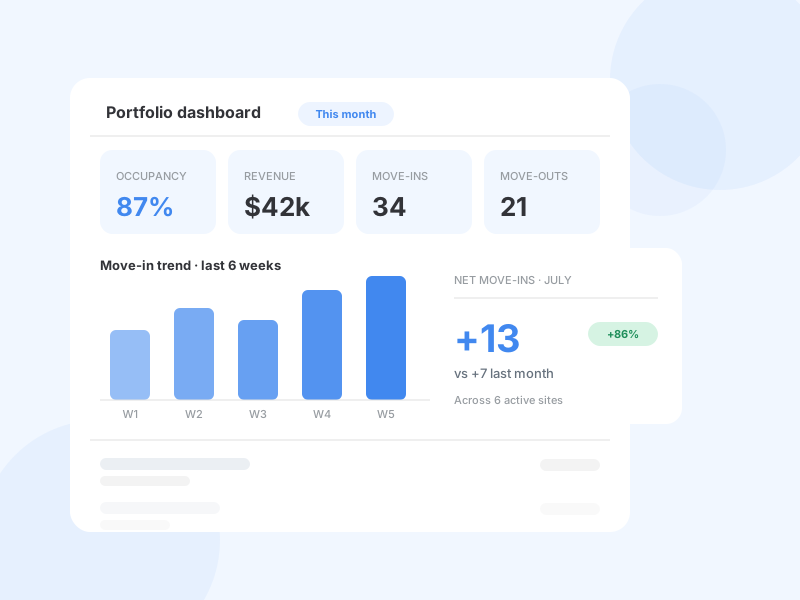
Track occupancy, revenue and performance across every site in real time, and build the exact reports you need in a couple of clicks.
Occupancy, revenue and move-in trends update live across every site. The KPIs you check daily sit on one screen, with no exports required.
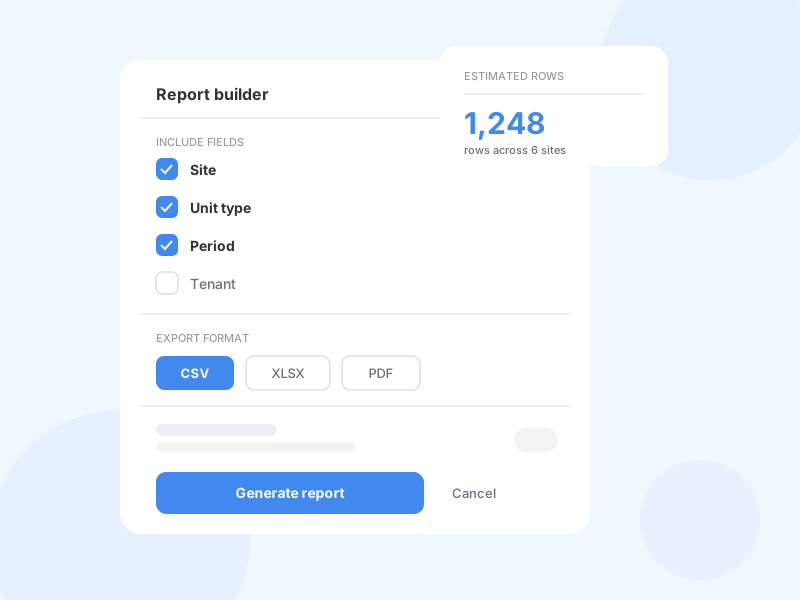
Create custom reports by site, unit type, period or tenant, and export them in any format. No rebuilding the same spreadsheet every month.
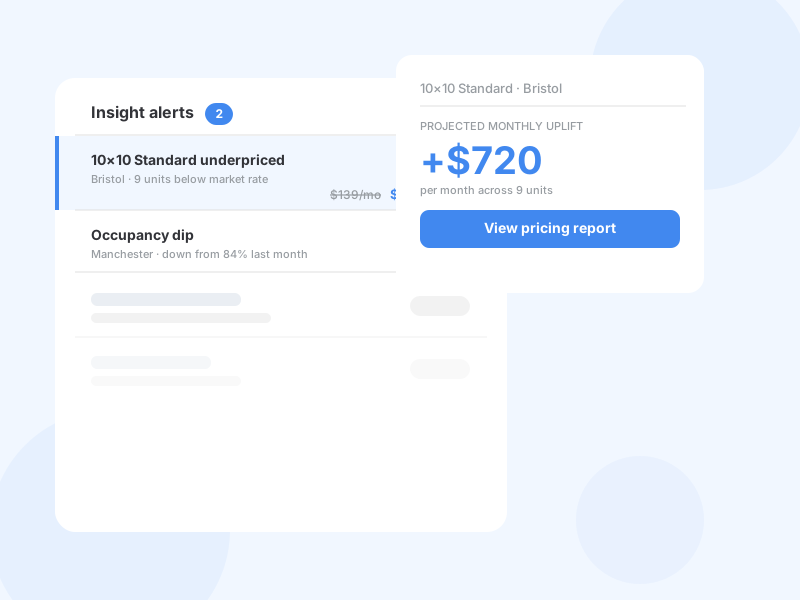
Revenue optimization alerts flag units priced below demand and surface trends worth acting on, so you catch opportunities (and problems) early. See them in Storeganise, or ask your AI tool through the AI Connector.
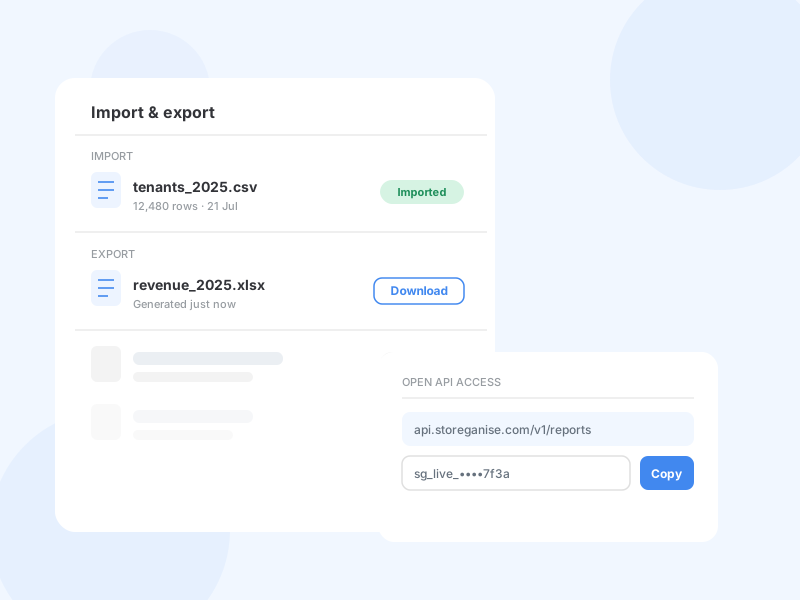
Import your full history, export everything anytime, and pull any figure through the open API. Nothing is locked in.
Connect the AI Connector to Claude, ChatGPT or your preferred AI assistant, then ask it to build a custom report or pull any figure in plain language.
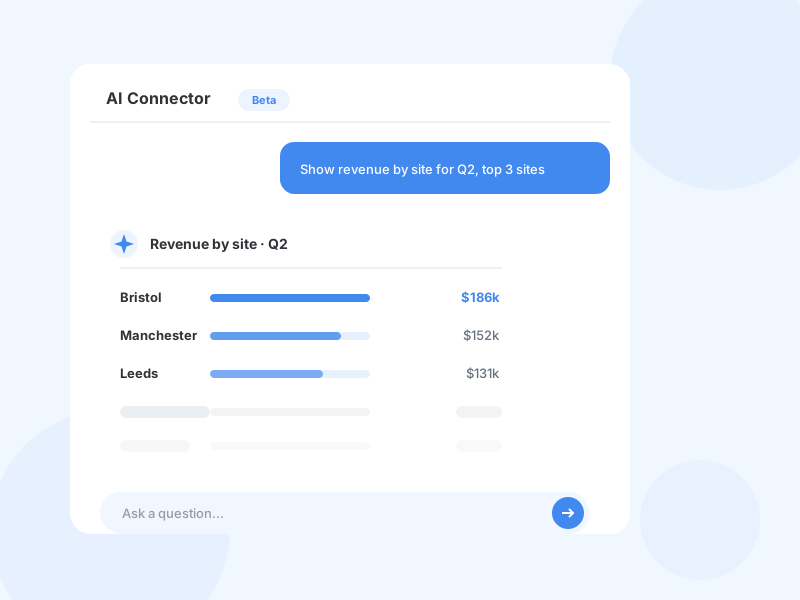
Why struggle with confusing data, when Storeganise turns your live operations into easy-to-understand reports?
Real-time KPIs, occupancy rates and revenue at a glance.
Create the exact reports you need and export in any format.
Surface price increases and trends worth acting on.
Bring your past data forward for a complete business history.
See website, booking and management data in one view.
Download everything anytime. Your data is always yours.
Feed Storeganise data into your analytics and BI tools, or connect it to your AI assistant with the AI Connector.

Track website and booking traffic and conversions with GA4.
Add tracking and connect advanced analytics without code.

Build deeper BI dashboards on your Storeganise data.

Pipe event data to Segment and on to your wider analytics stack.

Connect your live data to Claude, ChatGPT or your preferred AI assistant to query it in plain language.

Track which campaigns drive real move-ins and revenue (via Unwired Logic).
Self-storage reporting software turns your day-to-day operating data (occupancy, revenue, move-ins, payments) into dashboards and reports you can act on. Storeganise builds reporting and analytics into the platform, with real-time KPIs, a custom report builder and full data export, so you can see how every site is performing without exporting to a spreadsheet first.
The core self-storage KPIs are occupancy rate (by unit and by square foot), revenue per square foot, average rate per unit, move-ins versus move-outs, delinquency, and revenue growth across sites. Storeganise surfaces these on a real-time dashboard, so you can track the metrics that drive valuation without building the numbers by hand.
Unit occupancy rate is the number of occupied units divided by total units, shown as a percentage. Square-foot occupancy divides occupied space by total rentable space, which is the more accurate measure when unit sizes vary. Storeganise calculates both automatically and tracks them over time and across sites.
Break-even occupancy is the occupancy rate at which your rental income covers your operating costs and debt service. It varies by facility, but knowing it tells you how full you need to be to turn a profit. Storeganise tracks live occupancy and revenue per site, so you can see how each location sits against its break-even point.
Revenue per square foot is your total rental revenue divided by total rentable square footage, usually measured monthly or annually. It is one of the clearest ways to compare performance across sites of different sizes. Storeganise reports revenue and occupancy per site, so you can track it as rates and occupancy change.
Yes. The custom report builder lets you create reports by site, unit type, period or tenant, and export them in any format. You can also pull any figure through the open API or export your full dataset at any time, with no restrictions.
Yes. The dashboard consolidates occupancy, revenue and performance across every site, and you can drill into any single location. Website, booking and management analytics are integrated, so you see the whole funnel in one place.
Yes. The AI Connector connects your live Storeganise data to AI tools like Claude and ChatGPT, so you can ask your assistant to pull numbers, build reports or surface trends in plain language. Storeganise was first to market with this for self-storage.
Yes. Historical data imports bring your past records forward when you move to Storeganise, so you keep a complete business history and can report on trends from day one.
See how Storeganise helps your self-storage operations run smarter, so you and your team can grow your business, not your workload.